Scroll Depth Secrets: How and why to track it
You've created amazing content, provided captivating visuals, you've even done some serious social media promotion but the lingering question remains – are people staying on my website long enough to get to the information I want them to remember?
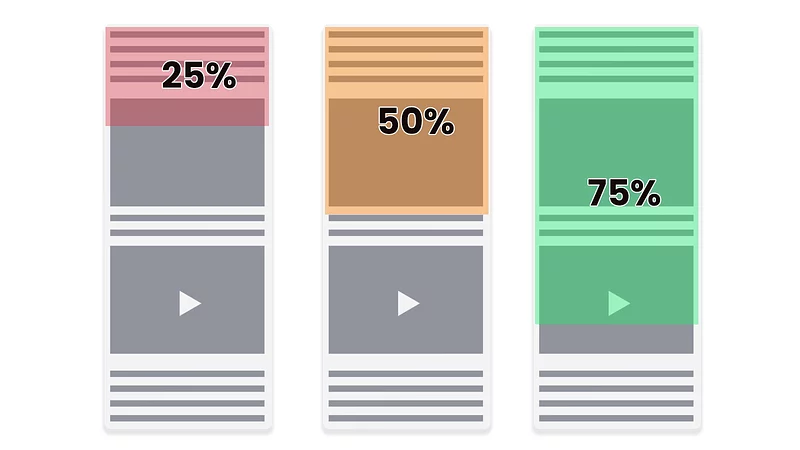
This is where understanding scroll depth becomes a game-changer in analytics. Scroll depth allows us to gauge user engagement by understanding how much users interact with our site – specifically, how far down they scroll. But laying hold of this information might seem a bit tricky for some of us who aren't tech giants or data nerds.
Why is it worth measuring scroll depth?
In the realm of web analytics, scroll depth plays a significant role in users’ experience with the website. Essentially, it gauges the extent to which a visitor scrolls down your webpage.
This metric is pivotal for several reasons:
- Content Consumption: Scroll depth serves as an indicator of the degree of consumption of your page content. In case readers scroll through most of your page and spend some time on it, you can consider that as an implication that they are finding your content useful or engaging.
- User Engagement Estimation: Contrary to belief, time spent on the site does not necessarily indicate high user engagement; a visitor could be idle on a particular page and not interacting with it at all. To complement this data point, scroll depth provides additional insights into actual active interaction time - a benchmark on how engaged the reader was with your content.
- Design Effectiveness Measurement: Scroll depth can also illustrate how effective your website’s design is in captivating users’ interest. An aesthetically pleasing and intuitively navigable layout typically compels visitors to delve deeper into the content hence increasing scroll depth. The effectiveness of a website extends beyond aesthetics to encompass the overall user experience (UX), including information architecture and content presentation. A well-structured layout not only enhances the visual appeal but also facilitates easy access to relevant information, thereby improving the user's journey through the site.
- Performance Evaluation: Measuring scroll depth can allow you to determine whether or not various sections of your webpage are performing optimally. If users aren't scrolling past certain points, there may be issues with those sections deterring them.

What is a Good Scroll Depth?
Any discussion about scroll depth would remain incomplete without defining what constitutes a 'good' scroll depth. Is there any prescribed benchmark for it?
Well, prescribing an ideal scroll depth value is problematic. It depends on various factors such as the context of your website, length of content, audience preference, layout design among other things.
More importantly, comparing different website scroll depths directly might lead to false assumptions due to varying content lengths and designs among websites. For example:
- An 80% scrolling rate on a short blog post may not equate to the same percentage in an extensive research article.
- Homepage scrolls could reflect differently when compared with product pages on e-commerce sites where users might browse extensively.
However, we would like to highlight two critical perspectives which can bring some light into this rather gray area:
- Content Relevancy: A higher scroll demonstrates that users find your content worthy enough to stick around and delve deeper. In general, longer user dwell time communicates positive signals about your content quality. Of course, with taking into consideration the time they spend on your websites, it is an important factor as well.
- Effective Layout: Whether users reach important sections/call-to-action(s) signifies efficient web designing. If they leave before reaching crucial sections despite relevant content then you need to ponder over improving your web layout/design. Taking into account scrolling up and down to search for content.
Ultimately, setting expectations based on these aspects over specific percentages and time spent on a website might prove more beneficial in enhancing user experience and site performance metrics.

How to Track Scroll Depth with Different Tools
When it comes to measuring user interaction on your webpage, scroll depth is a powerful metric every marketer should consider. The process of obtaining this valuable data varies from one tool to another. Let's delve into several methods you can employ to gather and analyze your scroll depth data.
Scroll Depth Data in Google Analytics
Google Analytics, particularly its latest version (GA4), adds considerable depth and flexibility to your toolkit for scroll track measurements. It extends far beyond the traditional click-rate analysis.
Scroll Depth Tracking Beyond Google Analytics
While Google Analytics stands as an industry standard, exploring other options can provide alternative perspectives and perhaps fill gaps left by GA4. Heatmaps:
Heatmap tools like Hotjar or Crazy Egg provide visualization for scrolling habits across different pages allowing you see exactly where users stop reading or interacting.
- Behavior Flow Reports: Accessible in older versions of Google Analytics (Universal Analytics) are Behavior Flow reports capable of showing when someone exits a page relative to their entry point - giving you greater context on their journey.
- Custom JavaScript Event Listeners: For those up to the challenge, adding a custom scroll event listener in JavaScript can give you fine-grained control over what gets tracked and how.
While each tool has its unique way to enhance your grasp on GA4 scroll depth or GA4 scroll events, a combination of multiple approaches often yields the most comprehensive understanding of users’ behavior. After all, becoming proficient in scroll tracking is an ongoing process - ever refining, learning, adapting and above all improving your content for better engagement.

Best Practices for Using Scroll Depth Data
Scroll depth data offers you insightful glimpses into how your users interact with your content. To use it effectively, here are some best practices to keep in mind.
Identifying Areas For Improvements Based On User Interaction With Content
Your website's scroll depth can provide many clues about user engagement. Begin by analyzing pages with high engagement rates, where readers scroll deepest and spend the most time. This might indicate successful areas of interest that can be capitalized on.
Next, look at low-engagement pages where visitors don't delve far or stay long—these represent opportunities for improvement. Dissect these pages to discern problematic elements like confusing navigation or unappealing text blocks and address them promptly.
Learn From Your Top Pages
Remember, success often leaves trails of breadcrumbs behind it! Probably more accurate to say that success scrolls deep in this context. Identify your top-performing pages in terms of scroll depth and seek patterns or shared features contributing towards their success.
You can learn from attributes such as the type of content (info-graphics, lists, videos), writing style (story-telling versus formal tone), visual design, and even the topic being discussed. Once identified, try mimicking these characteristics on other less engaging sections of your site.
Optimizing Introductions to Capture User Attention And Minimize Bounce Rate
If you find that skip rates are high right after your page loads, it points towards a lackluster introduction not gripping enough to pique users' interests.
Invest time crafting captivating headlines coupled with strong hooks in the first few lines of your content—that's a small change with massive potential impact. After all, if they're hooked initially they are much more likely to stick around & scroll down!
Implementing Data-driven Strategies for Improving Content Engagement
Replace speculations with hard data when revisiting your content strategy—the scroll depth data, along with other essential metrics like time spent on page and unique visitor count, can guide you in this.
Do the pages where users scroll deeper portray more graphics? Or perhaps they're loaded with bullet-pointed points for easier scan-ability? Follow these hints to tweak your content style and see how audiences respond.
Better Cross-device Experience
Scroll depth also tells tales about device-specific user experience. Perhaps desktop users browse content casually while mobile visitors are task-oriented. Accordingly, optimize cross-device experiences—more concise text blocks and clickable buttons for mobiles while a detailed textual description works better for desktops may be an example of applicable tweaks.
In essence, data-driven analysis of scroll depth paves way towards valuable improvements in boosting user engagement and delivering stellar website performance across devices—it's an asset worth exploring!
Related content

4 common website campaign mistakes to look out for
While there isn’t one, catch-all approach or technique, the best way to start ensuring the success of your campaign is to understand some of the most common mistakes companies make.
It’s for that exact purpose that we’ve put this article together!

 English
 한국어
한국어