Data-Driven Decisions:
Leveraging Page Speed Analytics for Website Optimization
No matter your business or industry, customer experience is king when it comes to determining the success of your website. Users who navigate to one of your pages only to find it unfulfilling are unlikely to stick around. Instead, they’ll likely find a more satisfying competitor website.
One of the most important elements of the digital customer experience is page speed. After all, no amount of engaging, innovative design will make a difference if your audience must undergo a lengthy wait before accessing the content you’ve published. So, one of your primary goals when trying to optimize your website should be to ensure its pages load quickly.
In order to provide a smooth digital experience, you’ll need to understand what determines page speed, how to measure it, and how to take action. To that end, in this article we’ll cover the basics, some more advanced metrics, and offer some advice.
Let’s get into it!
Defining page speed
Essentially, page speed is a summary of how quickly a web page loads and allows for user interaction. While this might seem simple, there are a variety of different metrics that determine a page’s speed and usability. As a starting point, page speed can be broken down into two key metrics: page load time and time to first byte.
First, page load time covers the amount of time required for the first content element to fully appear. Second, time to first byte indicates how long the browser takes to receive the first byte of information from the server. Together, these two categories summarize the loading speed of an individual page. However, the metrics involved paint a more detailed picture that can identify the specific challenges your business faces.
Keep in mind that page speed is different from site speed. The former indicates the loading time associated with a single page. Meanwhile, the latter summarizes the collective speed of a sample of page views to provide an assessment of their average loading time.
Measuring page speed
It might seem that measuring page speed could involve nothing more than a browser and a timer. However, the truth, as usual, is more complicated. To properly understand how long it takes for a page to load and why, you’ll need to perform proper analytics. This means breaking down page speed into a number of different metrics that explain what is slowing load time. Only then can you take the appropriate action.
First Contentful Paint
Whenever a page loads, multiple elements must come in separately. First Contentful Paint focuses on the time required for the very first piece of content to load completely. It indicates the initial delay between a user’s click and anything appearing and represents one of three Core Web Vitals.
With this metric, you can visualize the length of the digital customer journey’s first leg. While this doesn’t provide a complete summary of loading times, it does clarify whether your focus during optimization activity should be on the immediate interaction between your customer and the page.
Largest Contentful Paint
Videos and high-resolution images add a great deal to web design, but can also limit page speed. By looking at Largest Contentful Paint, a savvy business can understand if their page is limited by overly dense content.
This metric focuses on the most substantial element on your page rather than the first to load. Once the loading process has begun properly and content has appeared, there is a further wait until it finishes. As such, Largest Contentful Paint covers the second leg of the loading process. It offers insight into how much additional waiting is required between the initial appearance of content and when the page is complete.
First Input Delay
And for the third broad leg of the loading experience, we have First Input Delay, our second Core Web Vital metric. This measures the amount of time a user must wait for the browser to respond to an interaction attempt. Even once your page has visually loaded, users can still experience delays between a click and the expected action taking place. While the first two metrics we’ve discussed have focused on loading times, it’s important to remember that more goes into web page speed.
A high-level summary
These three metrics together lay out the entire experience that users go through in order to access your online content. Not only do they provide a complete timeline from the initial click to the completion of loading, they can break that process down. This offers businesses greater insight into the specific issues plaguing their websites, which enables more informed and targeted responses.
Together, First Contentful Paint, Largest Contentful Paint, and First Input Delay can build a strong, high-level summary. However, they are far from comprehensive.

A deeper dive
Other metrics exist that provide greater clarity into the various potential limitations to page speed. Understanding these more specialized methods for measuring loading times represents the next step in web page optimization..
Speed Index
This Google-specific metric studies how quickly the continents of a page are visibility populated. Considering the source providing this measurement of web page speed, it obviously factors into SERP rankings. As such, it’s important to ensure that your page is effectively optimized in order to lower its Speed Index as much as possible..
Through this metric, Google has attempted to encourage website owners to utilize less bulky images and simpler code. Keep in mind that search engines exist to provide the most relevant information and high-quality experience to users. By optimizing a web page, businesses not only help Google fulfill this objective but also boost their own visibility..
First CPU Idle
With CPU Idle, marketers can review how long it takes for a web page to become minimally interactive. This typically means that most but not all UI elements have loaded and begun to function. As such, pages that achieve shorter First CPU Idle times allow users to quickly access important links and buttons even as heavier elements continue to lead.
With this metric, you can gain greater insight into not only how soon your users can interact with your page but also the exact impact of denser images and videos on the page. By comparing First CPU Idle with other measurables, a business can look into the delay between initial interaction opportunities and the end of the loading process.
Time to Interactive
Similar to First CPU Idle, Time to Interactive emphasizes the importance of rapid usability. However, rather than simply studying the time it takes for any interaction to become possible, this metric looks at the delay before every possible interaction becomes available.
More specifically, “fully interactive” is defined in three ways. First, the page must display useful content. Second, event handlers must be registered for most visible page elements. And third, the page must respond to user interactions within 50 milliseconds. Once a page meets these three conditions, it is deemed able to present all relevant information and allow reliable navigation.
DOMContentLoaded
Rather than a metric that tests a specific element of your web page’s speed, this is an event triggered during loading. DOMContentLoaded launches when a browser has parsed the HTML document and built a DOM tree. This takes place prior to loading external resources such as images, style sheets, and scripts.
What does this mean for your users and web page speed? Well, DOMContentLoaded affects the perceived performance and usability of your content. The faster this event triggers and completes, the shorter the wait before your audience actually sees the page. Critically, this is an interaction tracked by key web page speed measuring tools.
Methods for measuring web page speed
So, now that we’ve covered both basic and advanced metrics related to page speed, you’ll need to know how to measure them. There are different techniques and tools out there that will track various metrics. Here we’ll cover a few of the options available to you as well as how they work.
Page timings Report
Effective reporting offers administrators a chance to review the average load times for individual pages. A page timings report can sort through a website and organize pages in different speed categories. Now, this kind of review only really delivers insight into which pages are loading slowly rather than why. However, such a starting point can save a great deal of time as you hone in on the problematic pages.
Tracking server time
At the end of the day web page speed largely relies on a site’s communication with a server. As such, it’s always helpful to take a closer look at the response times associated with this interaction.
A great deal of factors can affect how quickly a server responds to requests. The amount of traffic on a site and the resources on each page can both contribute to slower loading times. In addition, the particular choice of software and hosting solution can make substantial impacts.
When looking at your server, keep an eye out for potential performance bottlenecks. Watch for slow database queries, routing delays, and a lack of adequate memory. Remember that you’re aiming for a server response time of around 200 milliseconds. Anything longer can lead to a lesser user experience.
A/B testing
This technique, which is also known as split testing, is a randomized experimentation process. It simultaneously exposes two different versions of a variable, in this case a web page, to different segments of visitors. In doing so, the test determines which version has the greatest impact and most effectively improves metrics.
Using A/B testing, you avoid all of the guesswork connected to website optimization by enabling data-driven decision making. By comparing option A, the original page, to option B, the new version, the impact of changes on conversion metrics can be clearly determined. Keep in mind that those particular metrics will vary from one page to the next. As a result, when looking to set up an A/B test, take the specific objectives you have for the page into consideration.
Segmentation
This approach works by breaking down a web page into different segments and analyzing each individually. As opposed to reviewing the cumulative experience, this method allows analysts to focus only on the most essential elements. For instance, You can look at the performance of videos, buttons, and images in relation to web page speed.
By doing so, it becomes possible to gain valuable insights into the specific contributions of each individual element to loading and input times. The results can then be compared to identify the primary limiting factors when it comes to slow-loading pages.
Think of this as a similar process to breaking down the loading process into different stages. Redefining the scope of your analysis allows for comparisons that can lead to insights that are otherwise difficult to obtain. Segmentation enables page owners to perform more detailed review and identify challenges through comparison and a more detail-oriented focus.
Analytics tools
As with most forms of analysis, tools exist to make advanced review possible without requiring excessive manual effort and time. A number of options exist and their use will provide much greater access to the kind of insights described here.
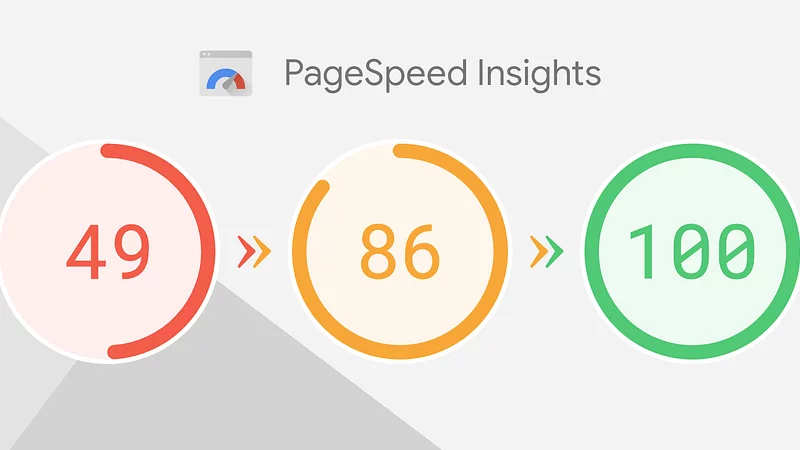
One of the most commonly used options is Google’s PageSpeed Insights, which incorporates data from the Chrome User Experience Report. This tool reports on a variety of impactful metrics related to the search engine’s ranking algorithm. This includes Core Web Vitals, which includes First Contentful Paint and First Input Delay as well as Cumulative Layout Shift, a metric that tracks a page’s stability.
In addition, PageSpeed Insights reports on Largest Contentful Paint and studies DOMContentLoaded to provide a comprehensive picture of a web page’s performance. Meanwhile, the diagnostics section helps drill down to the root cause of any issues.
Just keep in mind that PageSpeed Insights, like other analytics tools, can only help to measure and communicate the data. While this will clarify the situation, you will still need to define a course of action based on that information.
Acting on data-based insights
So, once you’ve got all the insights you could want, you’ll need to take action on optimizing your web pages. Often enough, you might find multiple challenges that need to be addressed. Even more likely, you might find a particularly important design element is the primary source of slower loading times.
In those cases, you’ll need to make decisions about prioritization and what is best for your particular business. We’d love to provide a universal tier list for the importance of different elements and performance metrics. However, every business, website, and web page are different. They possess and respond to different objectives.
As such, there really is no single, universal way of performing website optimization. At the end of the day, no amount of tools or analysis is going to be able to make prioritization decisions for you. Instead, each business will need to tailor its approach to fit its particular goals and the challenges facing its website.
Make sure to identify what successful optimization looks like. Establish your objectives ahead of time. Then when you’re actually performing the analytics and choosing a course of action, it will be far easier to define the best path forward.
A continuous journey
We have one final bit of guidance to leave you with, and that regards the timeline for optimization. This is not a one-and-done process.
Delivering a high-quality digital experience requires an ongoing commitment in terms of time, effort and resources.
Make sure to manage repeat audits of your website to find pages that don’t meet performance expectations. Iterate and iterate and iterate. Without this kind of a commitment, it will be difficult to deliver the customer experience you envision over an extended period of time.
Check how your websites perform
and see how it affects your revenue
Our platform thrives on authentic domains and live real user data – no simulations, just pure authenticity!
The best part? We can tailor it to your unique needs, custom-fitting it to your business.


 English
 한국어
한국어

