Article

7 Ways Website Performance Impacts Your Business and Marketing Goals

Picture yourself walking on a busy street in a bustling metropolis, going from one shop to the other. There is lots of noise and each shop owner is trying to convince you to choose them. 

You finally choose the one you like, but when you try to open the door… it’s stuck.  So what do you do?

Probably leave it and keep walking. After all, there will be another shop somewhere nearby. You have plenty to choose from.  Just as you are more likely to enter a well-lit, welcoming store with a functioning door, online visitors are more inclined to engage with websites that load swiftly and smoothly.

digital city

In a traditional brick-and-mortar scenario, abandoning one store for another requires leaving the outlet and physically traveling into the waiting arms of the competition. On the Web, competitors are just a couple of clicks away, writes Tammy Everts in “Time Is Money. The Business Value of Web Performance”.

"Okay," you may say, "but do users really care about and notice a few seconds difference? It can’t be that big of a deal, right?" It would be easier if this was the case. But it does make a difference. What's more, it seriously affects marketing campaigns as well as a company's business results and revenue.

 Many marketers are still not aware that there is a strong relationship between page loading speed and conversions and the costs of lost business. In fact, in many of the previous companies where I worked, we did not pay much attention to page speed. Of course we used to check websites’ speed for SEO and UX purposes, but linking every 1% of bounce rate directly with burnt marketing budgets wasn’t common back then. Low awareness of the significant impact poor web performance can have on campaign results is the result of a lack of proper tools that show the triangle relationship between loading speed, bounce rate, and conversions.

Our task at Reffine is to make marketers aware of how much they are losing and how much they could gain by improving website performance metrics. It's quite a challenge! – says Michał Miernik, Marketing Lead, Reffine.

michal miernik quote

For starters, let’s consider the following example:

In an A/B test, Vodafone directed traffic from various paid media channels to two identical landing pages. One was optimized for Web Vitals (Version A) and the other was not (Version B). Surprisingly, the only difference between the two versions was their Web Vitals optimization. Everything else remained the same.

Version A outperformed Version B in real-world user sessions, boasting a 31% better Largest Contentful Paint (LCP) score. The results were impressive:

  • an 8% boost in sales,
  • a 15% improvement in the lead-to-visit rate,
  • an 11% increase in the cart-to-visit rate.

  • We can run great campaigns, have fantastic creative concepts, and then lose out because our website falls short. That's why whether you're running an online store, collecting leads, or offering a service, one of the top business priorities should be striving to minimize page load times. – says Mateusz Zalubski, Head of Marketing, Incogni.

    vodafone lcp web performance

    Do people really notice a difference?

    Weber's Law, also known as the Just Noticeable Difference, addresses a critical question: "How much change is needed for customers to take notice?"  According to this law, a standard audience perceives a 20% change as substantial. Take a look at the picture below and see for yourself.

    For instance, when a company launches a sale, it might advertise discounts of at least 20% off to ensure customers perceive it as a significant deal. Smaller changes may not capture customers' attention. 

    This principle similarly extends to website performance, where even a half-second can equate to a significant 20% difference, as demonstrated by the following experiment: 

    In a Radware study, users were divided into two groups, each visiting the same website but at different speeds. The company employed a combination of eye-tracking and EEG technology to analyze what elements people pay attention to and how these elements shape their opinions.

    The mere half-second difference significantly influenced their view! Key findings revealed frustration peaks of up to 26%, occurring primarily during the browsing and checkout phases. Faster page loading enhanced user engagement and impacted brand perception, affecting the users’ perception of content, design, and navigation.

    So, the key takeaway is that although 0.5 seconds might seem inconsequential without context, it is noticeable to website users, whether consciously or unconsciously.


    Who is responsible?

    Keep in mind that it is everyone's responsibility to maintain high-quality website performance, not just your IT team.

     The user experience is often neglected by marketing teams because it is perceived as lying within the IT domain. I believe this is a big mistake because a website is the digital avatar of a company. Today, online performance strongly intersects with marketing activities and should not be delegated solely to the technical department, says Przemyslaw Marciniak, E-commerce Expert, Casbeg.

    For a company to work smoothly, all divisions should collaborate and take website performance into account.

    So, why don't they do so? Usually, it's due to a lack of communication or, even more often, a lack of understanding of how website performance impacts business results. Let's look at a case that illustrates this quite clearly:

    In 2012, Intuit's average website load times ranged from 12 to 15 seconds. So, the company embarked on an ambitious project to optimize 50 pages from six of its marketing websites and the results were astonishing! Intuit managed to cut loading times in half and, as a result, conversions increased by 14%!  However, it didn't start so smoothly... or rather, it didn't even get off the ground initially!

    We knew something had to be done. Engineering presented a case, but nobody got it. We just couldn’t get people to buy in. Everybody was too busy, nobody had any time, nobody had resources. This changed one day. We had a frustrated engineer who, on his own time, started to optimize some of our pages. We had a successful A/B test that showed that faster pages actually improved our metrics. All of a sudden, the conversation went from “We’re not interested” to “Hey, how fast can we optimize everything?", said Jay Hung, Chief Architect, WebMocha (for Intuit).

    project teamwork

    Key Web Performance Metrics 

    Google’s CRUX 

    Google, as the undisputed king of search engines, wields enormous influence over the success and visibility of websites. 

    Google is like the governor of our digital city. It has the power to decide which shops are more or less visible to passersby. 

    Slow-loading pages, clunky interfaces, and frustrating user experiences can drive visitors away in mere seconds. That is why Google has integrated Core Web Vitals into its algorithm, meaning that web performance directly impacts search rankings. This is where CRUX (Chrome User Experience Report) enters the picture. It offers valuable insights derived from real user data, making it a critical tool for improving website performance in the eyes of both users and search engines.  Understanding CRUX metrics is not only about optimizing for speed and usability; it's also about ensuring that your site remains competitive in the digital marketplace.

    Core Web Vitals

    These metrics can be challenging to grasp, so let's cover each of them.

    Largest Contentful Paint (LCP)measures the loading speed of the largest element on a webpage. Imagine you're in a store, and the most important product you want to see takes forever to appear on the shelf – that's similar to what LCP measures on a website.

    Another essential metric is First Input Delay (FID), which gauges the time it takes for a webpage to respond to user interactions, such as clicking a button. Think of it like the delay in a conversation when someone doesn't respond promptly to your question.

    Lastly, Cumulative Layout Shift (CLS) evaluates the visual stability of a page, indicating if elements shift unexpectedly while users are trying to interact with them. Picture yourself trying to click a button that suddenly moves as you're about to click – that's what CLS helps avoid.

    These metrics have been essential to date. However, in our ever-evolving digital landscape, Google plans to introduce a new metric known as Interaction to Next Paint (INP), which will replace FID. It measures a web page's responsiveness, meaning how quickly a page responds to interactions. Imagine you're on an e-commerce website, and you click the "Add to Cart" button. INP would measure the time it takes for the web page to respond by updating the cart and showing that your item has been added.

    core web vitals

    7 ways in which web performance impacts your business


    1) Conversion rates

    Your conversion rate is a score that tells you how many of the visitors to your website actually take a desired action. It could be making a purchase, signing up for a newsletter, or any other desired action. For example, if 100 people visit your digital shop, and 10 of them end up buying something, your conversion rate is 10%.

    Now, let's circle back to our main topic: website performance.

    As you might have guessed, poorly performing websites tend to have lower conversion rates, which equals less revenue. Research has revealed that the most favorable e-commerce conversion rates fall within the one to two-second loading time range, but plummet to a meager 0.67% when load times stretch to four seconds. Each additional second your website takes to load results in a diminishing conversion rate, declining by approximately 0.3%. Michael Wiegand, Director of Analytics at Portent, writes in this article:

    If 1,000 people visit your website to buy a $50 product, this could illustrate the difference in your potential earnings:

  • A 1 second page load time at a 3.05% conversion rate results in $1,525
  • A 2 second page load time at a 1.68% conversion rate results in $840
  • A 3 second page load time at a 1.12% conversion rate results in $560
  • A 4 second page load time at a 2.93% conversion rate results in $335

  • In the span of ~4 seconds, potential sales have dropped by just over $1,190.

    Even harsher data for businesses can be found in the report 'Milliseconds Make Millions' by Deloitte (commissioned by Google). According to this study, improving load time by just a tenth of a second can boost conversion rates by 8%.

    Of course, it differs from business to business, and I will cover the division between B2B and B2C organizations across different industries later. But one thing is sure: web performance has a huge impact on conversion rates. For additional proof, let’s dive into some case studies.


    1 second faster led to a 10% increase in conversion rates

    The performance engineering team of Staples.com, a leader in office supplies, embraced real user monitoring to track user experiences. In doing so, they revealed a crucial relationship between load time and conversions. They noticed that conversion rates peaked between 3 and 4 seconds, declining as load times increased.

    Armed with this insight, Staples assembled a cross-functional team spanning business, marketing, engineering, and analytics. They tackled excessive third-party calls and optimized images, two prominent areas of improvement.  The result was a full second shaved off the median load time of Staples.com's homepage, leading to a remarkable 10% increase in conversion rates.

    staples case study

    Walmart.com's Performance Boost

    The tech-savvy team at Walmart Labs recognized that the e-commerce giant Walmart.com was grappling with sluggish loading times, which affected the user experience.

    An initial analysis revealed that the slowest 5% of users had to wait a whopping 24 seconds for an item page to load! The culprits were familiar: excessive page elements, sluggish third-party scripts, and too many hosts contributing to page content.

    Walmart’s team sprung into action and repaired those mistakes.And the results? Every second of improvement in load time correlated with a 2% boost in conversion rates. Remarkably, for every 100 milliseconds of improvement, incremental revenue surged by up to 1%.

    walmart page speed

    Mozilla's Quantum Leap

    In 2010, Mozilla noticed that tFirefox was lagging behind Chrome in terms of landing page loading time. They recognized the impact of load time on download conversions and focused on optimizing JavaScript files while inlining CSS files.  The results exceeded expectations: a 2.2-second reduction in load time led to a remarkable 15.4% increase in download conversions, potentially translating to millions of additional Firefox downloads annually.

    mozilla load time decrease

    Renault’s 13% increase in conversions

    Renault, the renowned French multinational automaker with a global presence in over 130 countries, achieved substantial improvements by focusing on Core Web Vitals optimization.

    After reducing Largest Contentful Paint (LCP) to under 1 second, the company observed impressive results:

  •  A significant 14% decrease in bounce rates, indicating that users were more engaged and less likely to leave the website.
  •  A remarkable 13% increase in conversions, signifying more completed lead forms and business growth.

  • Furthermore, in Renault's top 5 European markets, the effort paid off with a notable 22% increase in the proportion of visitors experiencing a fast LCP of under 2.5 seconds. This improvement surged to 51%, and then again to an impressive 73% since early 2020, demonstrating the effectiveness of their Core Web Vitals optimization strategy.

    ranault load time decrease

    2) Bounce rates

    At the beginning of this article, as we were navigating through our digital city, we encountered poorly functioning doors, leading us to bounce away.

    Now, let's imagine that every fifth visitor lacks the patience to wait for the doors to open. This scenario would grant the digital shop a bounce rate of 20%. In simpler terms, 20% of the visitors to this digital shop leave after viewing only the front door… The bounce rate is a web analytics metric that quantifies the percentage of visitors who exit a website or webpage after viewing just one page without engaging further with the site.

    Much like how poorly functioning doors discouraged us from exploring a shop further, websites with subpar performance tend to exhibit higher bounce rates.

    bounce rate page speed

    NDTV is one of India's leading news stations and websites. With close to 200 million unique users every month, it was critical for NDTV to optimize its online presence to deliver a high-quality user experience. And they did just that. In just a month, they improved Largest Contentful Paint (LCP) by 55%, which correlated with a 50% reduction in bounce rates.

    ndtv results

    The Economic Times, with over 45 million monthly active users, recognized the need to enhance website responsiveness. Their primary focus was on enhancing Largest Contentful Paint (LCP) and Cumulative Layout Shift (CLS). 

    After a few months of optimization, their CLS improved by 250%, decreasing from 0.25 to 0.09 seconds. Similarly, LCP showed an 80% improvement, dropping from 4.5 to 2.5 seconds.

    The result was a notable 43% reduction in bounce rates.

    the economic times results

    3) Customer Acquisition Cost

    The speed at which your webpage loads plays a direct role in your Ad Rank, Quality Score, and, ultimately, your Customer Acquisition Cost. The PPC landscape evaluates a range of metrics to assess a page's Quality Score, similar to expectations for organic search.

     From the perspective of always-on marketing campaigns - Google Ads, Facebook, and other PPC channels, affiliations, etc. - that I've managed in my e-commerce efforts, speeding up the website and optimizing its technical performance has led to improved conversion rates, allowing us to achieve better returns on investments, says Mateusz Zalubski, Head of Marketing, Incogni.

    Edmunds, a web source for car reviews, decided to revamp their website, InsideLine.com. They started with a sluggish 9 seconds and went down to an impressive 1.6 seconds. 

    This enhanced speed minimized discrepancies in ad impressions and yielded a significant 3% boost in ad revenue. 

    edmunds ads

    GQ provides another interesting example:

    In 2015, the company faced a challenging problem as its average page load time had ballooned to a sluggish 7 seconds. The remedy was a comprehensive overhaul aimed at optimizing ads, third-party tags, and additional features. Simultaneously, GQ transitioned to a unified content management system. This strategic overhaul resulted in a remarkably streamlined site that reduced server requests by a staggering 400%. As a result, load times were slashed by an impressive 80%, bringing them down to just under 2 seconds.

    The relaunched site quickly reaped a plethora of advantages, including:

  •  An impressive 83% surge in traffic, skyrocketing from 6 million to 11 million unique visitors.
  •  A noteworthy 32% increase in the average time spent on the site, climbing from 5.9 minutes to 7.8 minutes.
  •  An astounding 108% boost in the interaction rate with ads, showcasing the site's newfound engagement and user satisfaction.
  • gq magazine results

    4) Abandoned shopping carts

    Imagine you're in a hurry, but you stop by a nearby shop for a quick snack.

    You reach the cashier, only to find yourself in a long queue. Minutes pass, and your anxiety grows.  You can’t take it any longer and you decide to leave without making a purchase.

    In the digital realm, those minutes translate into seconds. Just one second too long can cause customers to abandon their online shopping carts.

    In 2011, Strangeloop collaborated with a client interested in investigating the effects of slowing down page loading during a five-step transaction. To conduct this study, they implemented a split test, dividing the incoming traffic into three distinct groups, each subjected to a different user experience:

  •  Group 1, the baseline, enjoyed a fully optimized transaction.
  •  Group 2 encountered a deliberate 2-second delay, specifically affecting page 3 of the transaction.
  •  Group 3, on the other hand, faced a 2-second delay, but this time it targeted page 1 of the transaction.

  • Remarkably, the study uncovered a stark revelation: a mere 2-second delay in page load time during the transaction led to abandonment rates skyrocketing to as high as 87%.

    strangeloop web performance

    AutoAnything, a retailer specializing in automotive accessories, needed to promptly deliver high-quality content. Even though they employed a content delivery network, their homepage's loading time stretched to as much as 10 seconds, leading to a substantial rate of abandoned shopping carts.  So, they got to work and reduced their page load times by half.

    And it was clearly worth the work. Conversion rates soared by 9%, the average cart size increased by 11%, and sales experienced a substantial surge ranging from 12% to 13%.

    autoanything web performance

    5) Engagement 

    In a revealing study conducted by The Financial Times, the correlation between page speed and user engagement became abundantly clear.

    To investigate this relationship, the newspaper conducted two comprehensive tests spanning approximately four weeks each. In the initial test, subscribers were divided into two equal groups. 

    One group encountered the standard website experience while the other endured a deliberate 5-second delay added to every page load.

    The first test yielded a significant drop in engagement for the slower-loading group, prompting a second round of testing. This time, users were segmented into four cohorts, each experiencing varying delays in page loading.

    While shorter visits, during which users visited only two pages, showed minimal impact across all test variants, a notable decline in engagement emerged for users exploring three pages or more. The deeper the user's journey, the more pronounced the drop-off in engagement. At the slower loading speeds (5 seconds and 3 seconds), this trend plateaued at around the 10-page mark, resulting in an 11% decrease for the 5-second variant and a 7.5% decrease for the 3-second variant. However, at 2 seconds and 1 second, the disparity in engagement continued to widen.

    What's even more striking is that the negative impact of slower page speeds persisted and intensified over time. Over the course of the study:

  •  Users experiencing a one-second delay saw a 4.9% drop in articles read over the first seven days, compared to the control group.
  •  For those subjected to a three-second delay, the difference grew to a significant 7.2% within the same timeframe.
  •  After 28 days, the gap widened even further for the two- and three-second delay variants, reaching 5% and 7.9%, respectively.

  • In summary, the study highlighted a clear and compelling link between page speed, user engagement, and long-term revenue. Slower page load times not only deterred users within a single session but also led to a persistent decline in readership over time.

    the financial times web performance

    6) Brand loyalty

    Earlier, I mentioned the Radware study in which a mere 0.5-second decrease in page speed had a significant impact on user experience. What I did not mention is that the experiment’s participants who used the slower website not only negatively evaluated the website itself but also the brand that owned it.

    The delay in page loading created a ripple effect, causing users to view the business as less reliable, less technologically competent, and less attentive to user experiences. In other words, the sluggish website tainted overall brand perception.


    7) Ranking in search engines

    The impact of website performance on SEO is not as significant as on bounce rates or conversion rates. Many different factors determine search rankings.

    That being said, web performance is one of those factors.

    In May 2022, Advanced Web Ranking found a slight correlation between low LCP and high search ranking from three million web pages in the top 20 Google search results. 

    We can complain about Google, but we have to admit that their absolute priority in SERP is user satisfaction. Therefore, their goal is to deliver the best-matched results possible, as well as ensure that the overall user experience is as good as it can be. So, even if we have top-quality content, if our website loads slowly, we will most likely rank lower in search engine results compared to the competition, says Mateusz Zalubski, Head of Marketing, Incogni.

    mateusz zalubki incogni quote

    As John Mueller, Search Advocate at Google, wrote in 2021:

    It is a ranking factor, and it’s more than a tie-breaker, but it also doesn’t replace relevance.

    Depending on the sites you work on, you might notice it more, or you might notice it less. As an SEO, a part of your role is to take all of the possible optimizations and figure out which ones are worth spending time on. Any SEO tool will spit out 10s or 100s of “recommendations”, most of those are going to be irrelevant to your site’s visibility in search. Finding the items that make sense to work on takes experience. The other thing to keep in mind with core web vitals is that it’s more than a random ranking factor, it’s also something that affects your site’s usability after it ranks (when people actually visit). If you get more traffic (from other SEO efforts) and your conversion rate is low, that traffic is not going to be as useful as when you have a higher conversion rate (assuming UX/speed affects your conversion rate, which it usually does). CWV is a great way of recognizing and quantifying common user annoyances.

    Page experience is just one of many signals that are used to rank pages. Keep in mind that intent of the search query is still a very strong signal, so a page with a subpar page experience may still rank highly if it has great, relevant content.

    john muller twitter quote

    Other aspects to consider

    I've compiled some additional points and differentiations that I believe are important for a comprehensive discussion of loading speed. This way, we can gain a better understanding of the multifaceted nature of website performance and its impact on the user experience and business outcomes. These aspects include:

  •  B2B vs. B2C
  •  Mobile Website Speed
  •  Impact in different industries

  • B2B and B2C differences

    I covered a lot of Business to Consumer (B2C) case studies, and it seemed logical to assume that Business to Business (B2B) organizations would be less affected. After all, B2B decision-making processes tend to be more protracted, so the significance of a few extra seconds of loading time might not seem like a big deal. When I initially researched this topic, I held this view.

    And I was mistaken.

    The impact of website speed on B2B is as significant as B2C, according to Potent's research. Their methodology involved a comprehensive analysis of over 100 million page views over a 30-day period, encompassing measurements of page load speeds in 5.6 million sessions across various websites. Out of these websites, six were dedicated to B2C e-commerce while the remaining 14 were focused on B2B lead generation. These websites spanned a wide spectrum ranging from nationally recognized travel brands to smaller, specialized software-as-a-service companies. The findings concerning B2B websites are particularly striking:

    The connection between site loading speed and conversion rates is remarkable. Websites that load within 1 second achieve a conversion rate three times higher than those that take 5 seconds to load.

    The disparity becomes even more evident when comparing fast-loading sites to slower ones. A website with a 1-second loading time boasts a conversion rate five times higher than one requiring 10 seconds to load.


    Mobile vs. computer website speed

    When envisioning a website, my mind conjures up the image of a computer screen rather than a mobile device. This inclination is shared by many marketers.

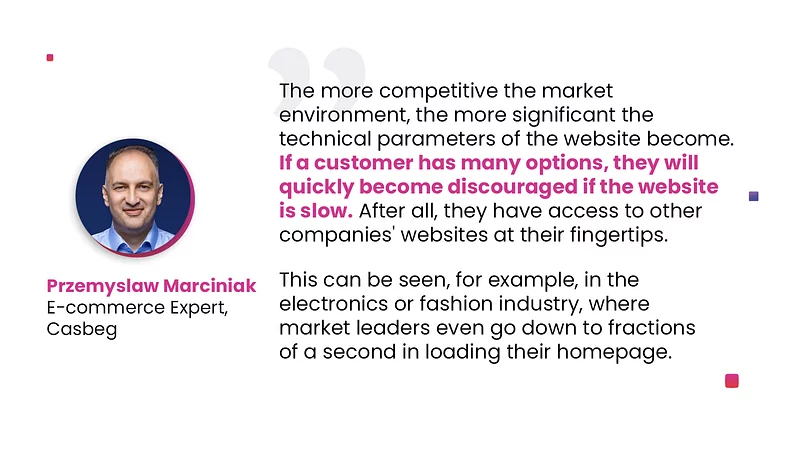
    A lot has been said about the "year of mobile," and it arrived at some point, but it's unclear exactly when, and the Rubicon has already been crossed. Today, mobile dominates, with some websites seeing as much as 70-90% of their traffic coming from mobile devices. We must remember that mobile phones are usually less powerful, and we often use them on the go. Therefore, the speed of the website becomes even more crucial, says Przemyslaw Marciniak, E-commerce Expert, Casbeg.

    Despite the fact that more and more people use mobile devices to browse websites, most marketers still optimize their sites only for computers. Consequently, many mobile websites are burdened with high-resolution (or “heavy”) and hidden images, which further slow down loading times.

    Additionally, mobile devices often rely on cellular networks, which can have slower speeds and less reliable connections compared to wired broadband connections. While responsive design aims to make websites work well on both desktop and mobile, it can sometimes result in more complex code and larger file sizes for phones and tables, leading to longer loading times. All in all, mobile faces a tougher starting point. And when combined with the fact that it's often overlooked, the consequences for a company can be painful.

    And yet, even a slight enhancement in mobile speed can yield favorable business outcomes for brands. 

    Deloitte researchers conducted an analysis of mobile site data from 37 brands spanning the retail, travel, luxury, and lead generation sectors across Europe and the United States over a four-week period. The findings indicate that even a minuscule 0.1-second alteration in loading time can make have major impact on every facet of the user journey, ultimately leading to better conversion rates.

    Specifically, the study revealed that for retail websites, a 0.1-second improvement resulted in an 8% increase in conversions, while travel websites saw a remarkable 10% boost on average. Furthermore, with this modest 0.1-second enhancement in site speed, retail consumers displayed nearly a 10% increase in spending. In addition, user engagement surged in terms of lead generation and luxury segments, uwith page views soaring by 7% and 8%, respectively.

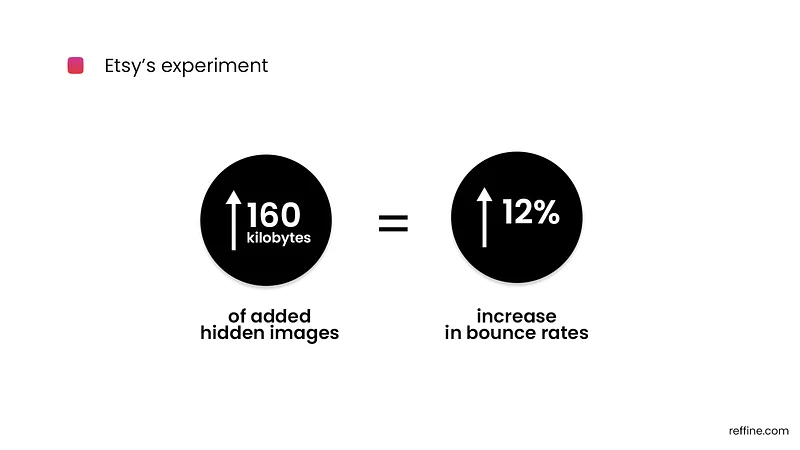
    Etsy also conducted an experiment:

     We ran this experiment on mobile web where we added 160 kilobytes of hidden images, meaning the user saw nothing different. We just dumped a bunch of hidden images onto the page and increased page weight by 160 kilobytes. It triggered a 12% increase in bounce rate. Insane. Twelve percent is a lot of percent, said Lara Hogan, Senior Engineering Manager, Etsy.

    etsy web performance mobile

    Google also conducted a study focused on mobile website speed. Their objective was to quantify the difference in user perception when a mobile website takes 13 seconds to load compared to a swift 3-second load time. Given the significant disparity in load times, the expected impact was substantial.

    What distinguishes this study and the reason I am highlighting it is the inclusion of a video that captures people's reactions. To carry out this experiment, Google created a fictional brand called "Nordid Interior" and conducted the test in Denmark. Participants were recruited to evaluate the website using various criteria and determine whether they would recommend this virtual webshop to their friends and family.

    The results reveal that, on average, individuals were 10% more inclined to recommend the webshop when the load time was reduced by just 3 seconds, transitioning from 13 seconds to 10 seconds. Going a step further, a more substantial reduction—from 13 seconds to 3 seconds—resulted in an estimated 26% surge in advocacy for the website.

    As customer expectations continue to rise and smartphone usage proliferates, the imperative for mobile speed intensifies. And the competitive divide delivered by exceptional mobile experiences is only poised to expand in the future.

    Impact in different industries

    The more competitive the market environment, the more significant the technical parameters of the website become. If a customer has many options, they will quickly become discouraged if the website is slow. After all, they have access to other companies' websites at their fingertips. This can be seen, for example, in the electronics or fashion industry, where market leaders even go down to fractions of a second in loading their homepage.

    In the case of companies that specialize in something or offer unique products, users tend to have a bit more patience because they don't have as many alternatives, says Przemyslaw Marciniak, E-commerce Expert, Casbeg.

    przemyslaw marciniak casbeg

    Competitiveness is one of the more important factors in deciding how much website speed should matter for a company. Therefore it is important to keep tabs on your competition. 

    Illustrate Digital conducted an interesting study that compared website speed in different industries.  Here are just a few of their findings (more in this link) about avarage page speed by sector:

  •  Computer software & development – mobile 8.1s, deskop 2.1s;
  •  Banking – mobile 9.4s, deskop 2.1s;
  •  Fashion – mobile 3.2s, deskop 1.1s;
  •  Digital marketing – mobile 4.4s, deskop 1.4s.

  • According to Illustrate Digital, in 2023 the fashion industry had the fastest average load times of any sector, followed by property and digital marketing.


    Useful tools

    There are quite a few useful tools that check website speed. Here we’ll cover a few of them:

    Google PageSpeed Insights

    This tool analyzes your website's speed on both desktop and mobile devices. It provides recommendations to improve performance and scores your website based on its performance metrics.

    GTmetrix

    GTmetrix offers detailed reports on your website's performance, including page load times, PageSpeed, and YSlow scores. It also recommends how to optimize your site for faster loading.

    Pingdom

    The Pingdom Website Speed Test allows you to check your website's load time from different geographic locations and provides a performance grade, along with suggestions for optimization.

    WebPageTest

    WebPageTest is a robust and highly customizable tool that provides detailed performance testing options. You can test your website's speed from various locations and browsers, view waterfall charts, and access advanced performance metrics.

    Lighthouse (Chrome DevTools)

    Lighthouse is integrated into Google Chrome's DevTools and is widely used for auditing web page performance. It provides scores and recommendations for performance, accessibility, SEO, and more.

    We have worked with many of these tools for years and confidently recommend them. However, during that time, we have also identified areas where they may fall short and have recognized features that could be valuable to some of our clients, particularly larger enterprises. Based on everything we learned, we created our own tool to help companies with improving website performance!


    Reffine Insights

    It seems to me that marketers are already overwhelmed by the number of dashboards they have to log into and analyze data independently. Often, they don't really know how to connect all of this information together. That's why a tool like Reffine Insights, which provides relevant business information rather than dry numbers, makes the work easier for many people, says Michał Miernik, Marketing Lead, Reffine.

    Our tool doesn't seek to compete directly with other solutions; rather, it complements them by providing companies with valuable business insights based on their website's performance. Consequently:

  • Companies can assess how their websites perform on a global scale and in various markets.
  •  They can conduct comparisons between their own websites and those of regional competitors.
  •  Users can instantly translate any metric into meaningful business terms to understand how their website’s performance contributes to potential monetary losses.

  • Reffine Insights provides an overview of your entire website infrastructure. If there's an issue, such as a slowdown due to faulty code being added to the GTM, we can identify the problem and take appropriate action. What’s more, you can compare your websites to direct competitors across different countries. For example, Jaguar can assess how its corporate website performs in Dubai by comparing it with the websites of Ferrari or BMW in the same country. This provides you with a ‘vanity point,’ allowing you to gauge your performance against others, says Adam Wardach, CEO, Refine.

    adam quote
    Reffine Insights

    Check how your websites perform
    and see how it affects your revenue

    Our platform thrives on authentic domains and live real user data – no simulations, just pure authenticity!
    The best part? We can tailor it to your unique needs, custom-fitting it to your business.